
Advertisement
Advertisement
Natural Gas, WTI Oil, Brent Oil Forecasts – Oil Pulls Back As Crude Inventories Rise
By:
Key Points:
- Natural gas failed to settle above the psychologically important $3.00 level.
- WTI oil moved towards the $70.00 level as traders focused on the EIA report.
- Brent oil pulled back towards the $74.00 level.

In this article:
Natural Gas
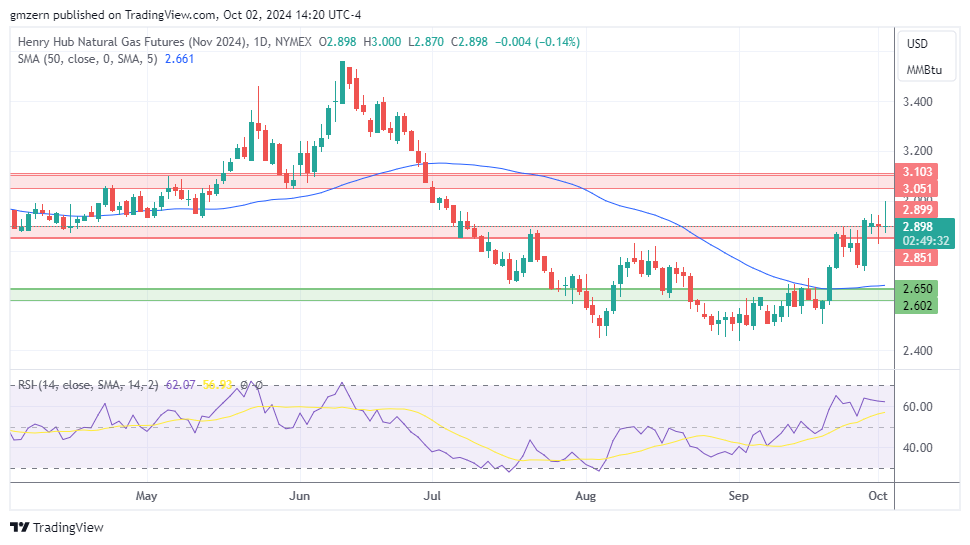
Natural gas made an attempt to settle above the $3.00 level but lost momentum and pulled back towards $2.90.
If natural gas settles below $2.85, it may gain additional downside momentum and move towards the nearest support at $2.60 – $2.65.
WTI Oil
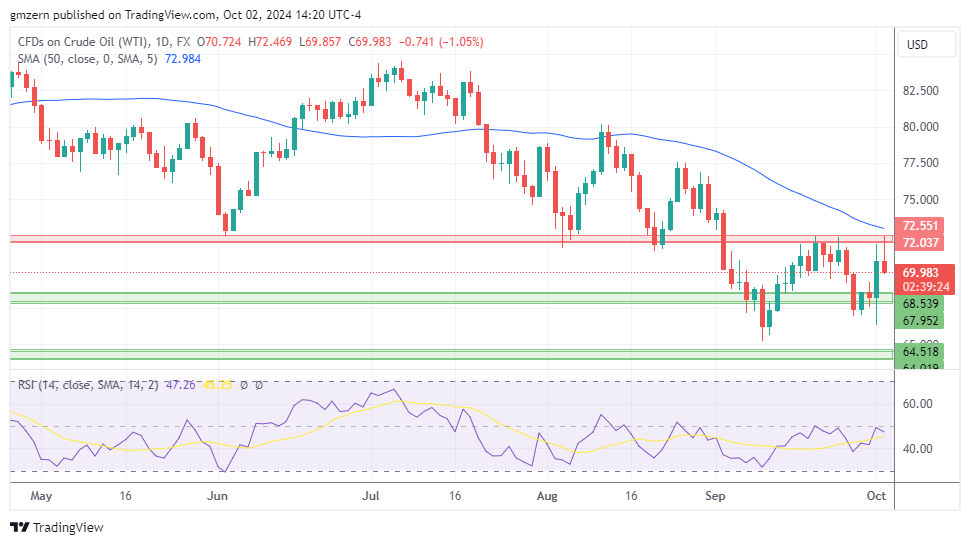
WTI oil retreats as traders focus on the EIA Weekly Petroleum Status Report, which indicated that crude inventories increased by 3.9 million barrels from the previous week.
A move below the $70.00 level will open the way to the test of the support at $68.00 – $68.50.
Brent Oil
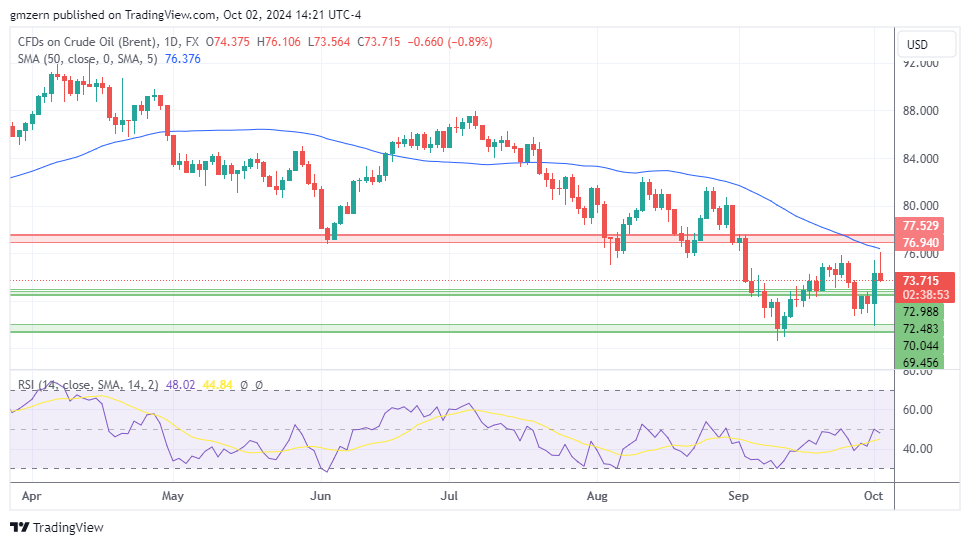
Brent oil pulled back as traders reacted to EIA data and focused on the developments in the Middle East.
A successful test of the nearest support level at $72.50 – $73.00 will open the way to the test of the next support at $69.50 – $70.00.
For a look at all of today’s economic events, check out our economic calendar.
About the Author
Vladimir Zernovauthor
In more than 15 years of trading in the financial markets, Vladimir dealt with a wide range of brokers and financial instruments. His career as a day-trader at a proprietary trading firm goes back to 2007. Later, Vladimir turned to longer time frames and became an independent trader and analyst managing his own portfolio. Using his experience, he helps traders find the best broker in his reviews.
Latest news and analysis


Advertisement