
Advertisement
Advertisement
Gold, Silver, AUD/USD Technical Analysis Ahead of US Nonfarm Payrolls
By:
Key Points:
- Silver (XAG) failed to break above the key $32.5 level.
- Gold (XAU) is looking for support as the correction is nearing its end.
- AUD/USD will likely remain strong as gold trades at record highs.

In this article:
Gold (XAU) and Gold (XAU) continued to correct lower after the market opened on Monday, while the US Dollar went up as Fed Chair Powell mentioned that the central bank would gradually lower interest rates. This correction in gold and silver is due to the market’s overbought conditions. However, the escalation of the geopolitical crisis in the Middle East will likely provide additional support for precious metal prices. Meanwhile, AUD/USD remains strong while gold trades near record levels. Upcoming ISM Services PMI data on Thursday and US Nonfarm Payrolls data on Friday are expected to significantly impact gold, silver, and AUD/USD.
Gold (XAU) Technical Analysis
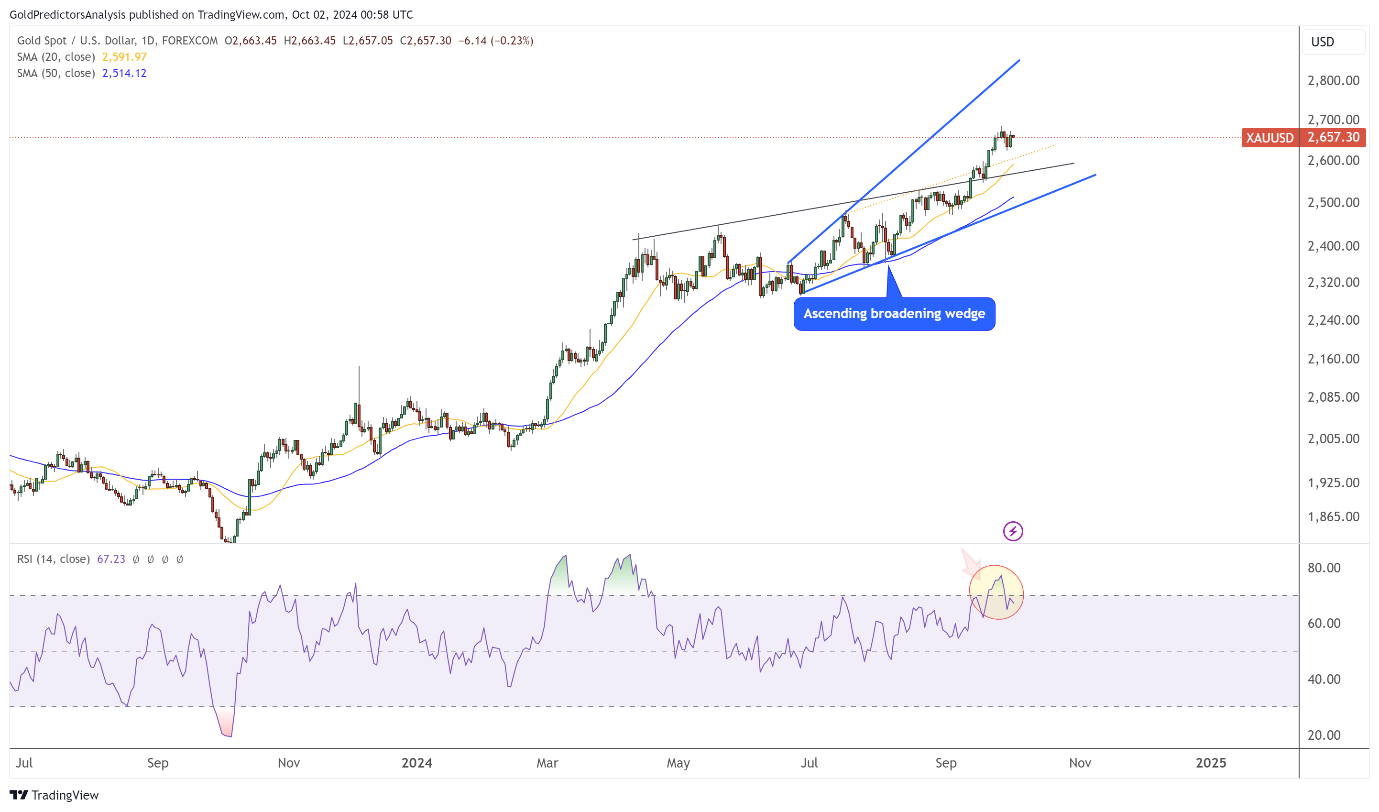
Gold Daily Chart – Is Price correction over?
Gold has been trading within an ascending broadening wedge and trending higher. The overall trend remains upward, as the price is above the 20-day and 50-day SMAs. However, gold is extremely overbought in the short term, as the RSI indicates. Therefore, the price is correcting lower toward the yellow dotted trendline, which intersects with the 20 SMA. Therefore, this price correction is likely to find support around 20 SMA, where the next buy signal may emerge. The gold remains upward trending as long as the price remains above $2514.
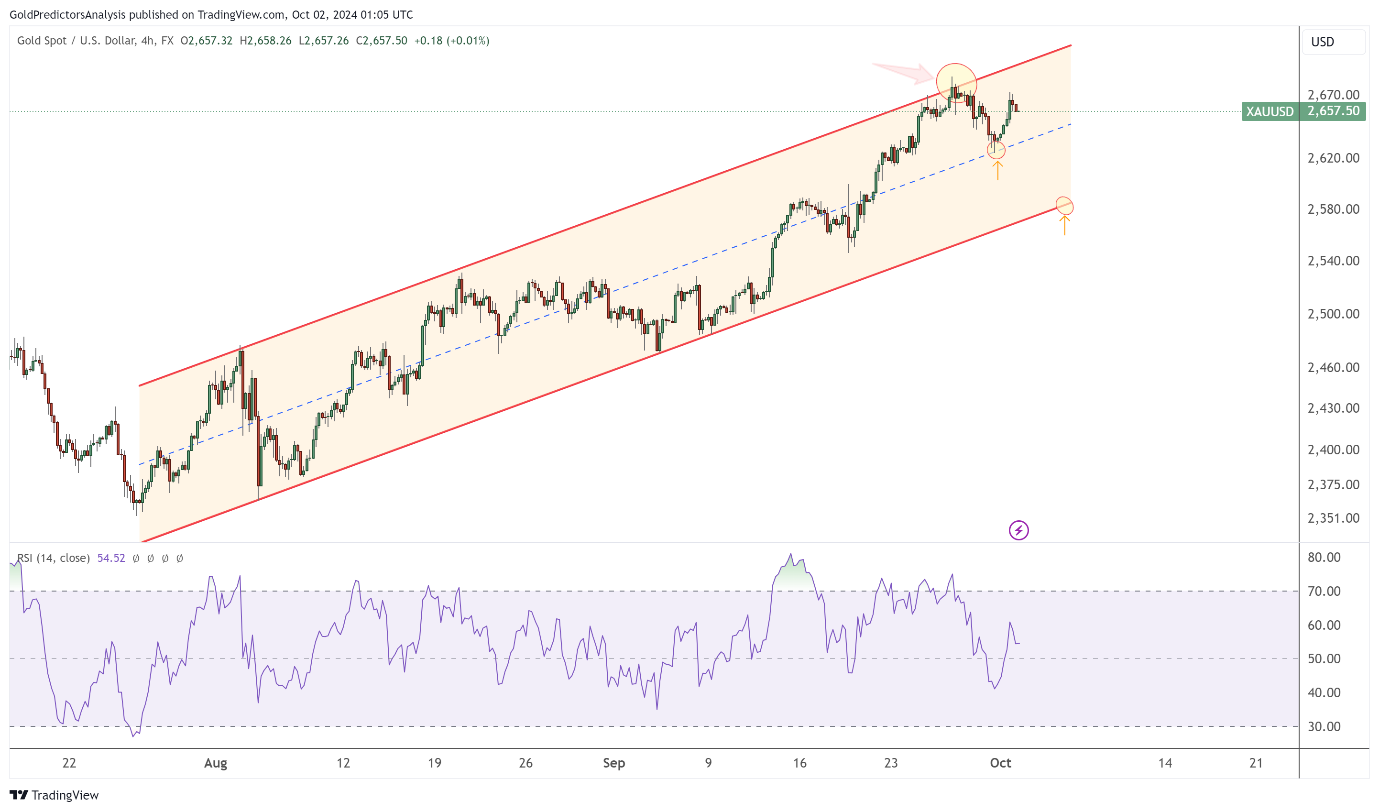
Gold 4-Hour Chart – Ascending Channel Pattern
The gold market also trended higher on the 4-hour chart, forming an ascending channel pattern. The price peaked at $2,685.64 on Thursday last week, reaching the resistance level of this ascending channel. However, gold is currently finding support at the midline of this channel and rebounded higher on Tuesday. Two support levels are visible on the 4-hour chart: the midline support at $2,630 and the lower channel support at $2,582. These support levels are also observed on the daily chart above.
Silver (XAG) Technical Analysis
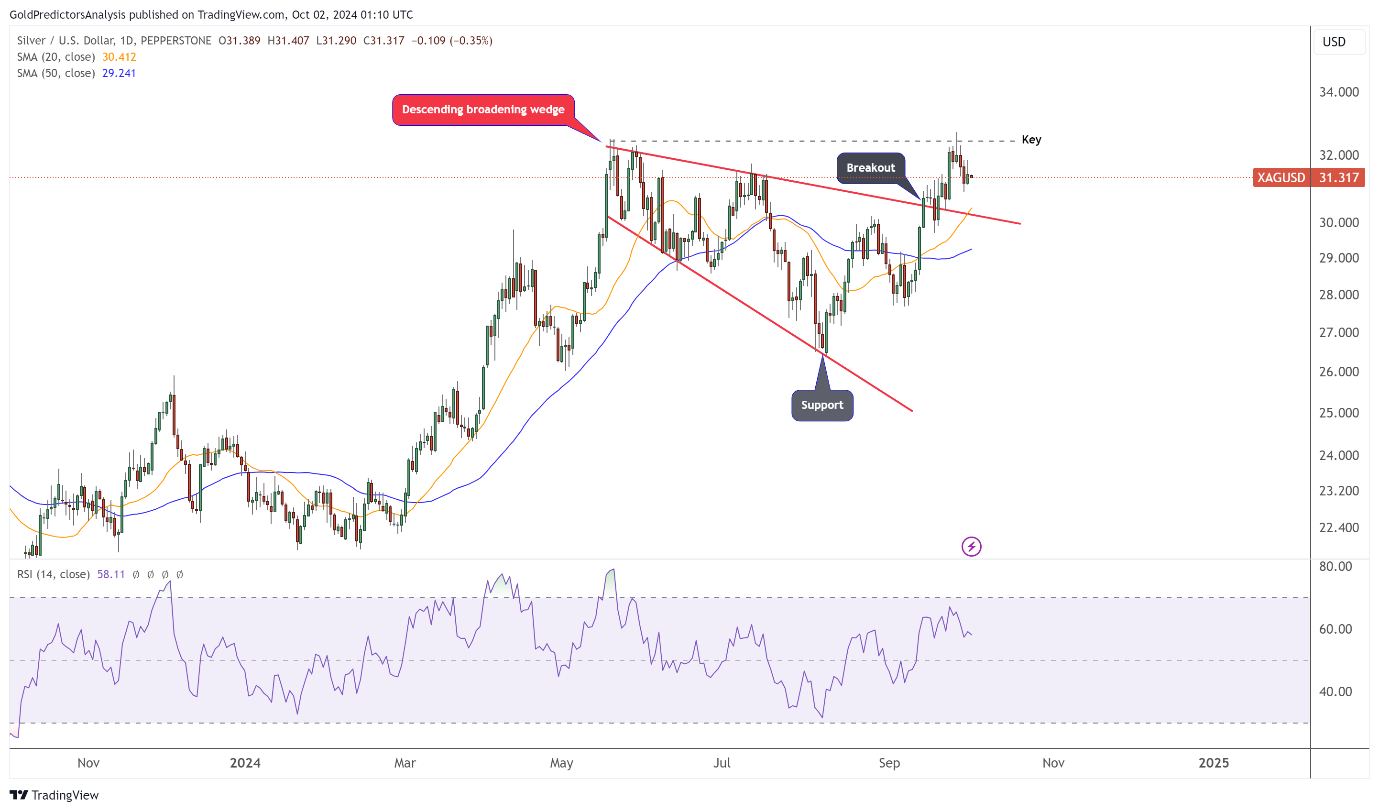
Silver Daily Chart – Will Silver break $32.50?
Silver has broken out of the descending broadening wedge pattern, as seen on the daily chart. The price reached the key level of $32.50. The price could not break through this key level and is now consolidating above the 20 SMA. The overall trend remains upward if the price remains above the 50 SMA. However, the breakout from the descending broadening wedge indicates that the trend will likely continue higher after a break above the key level at $32.50. If silver drops in the short term, it will likely find support between the 20 and 50 SMA, within the price range of $30.412 and $29.241.
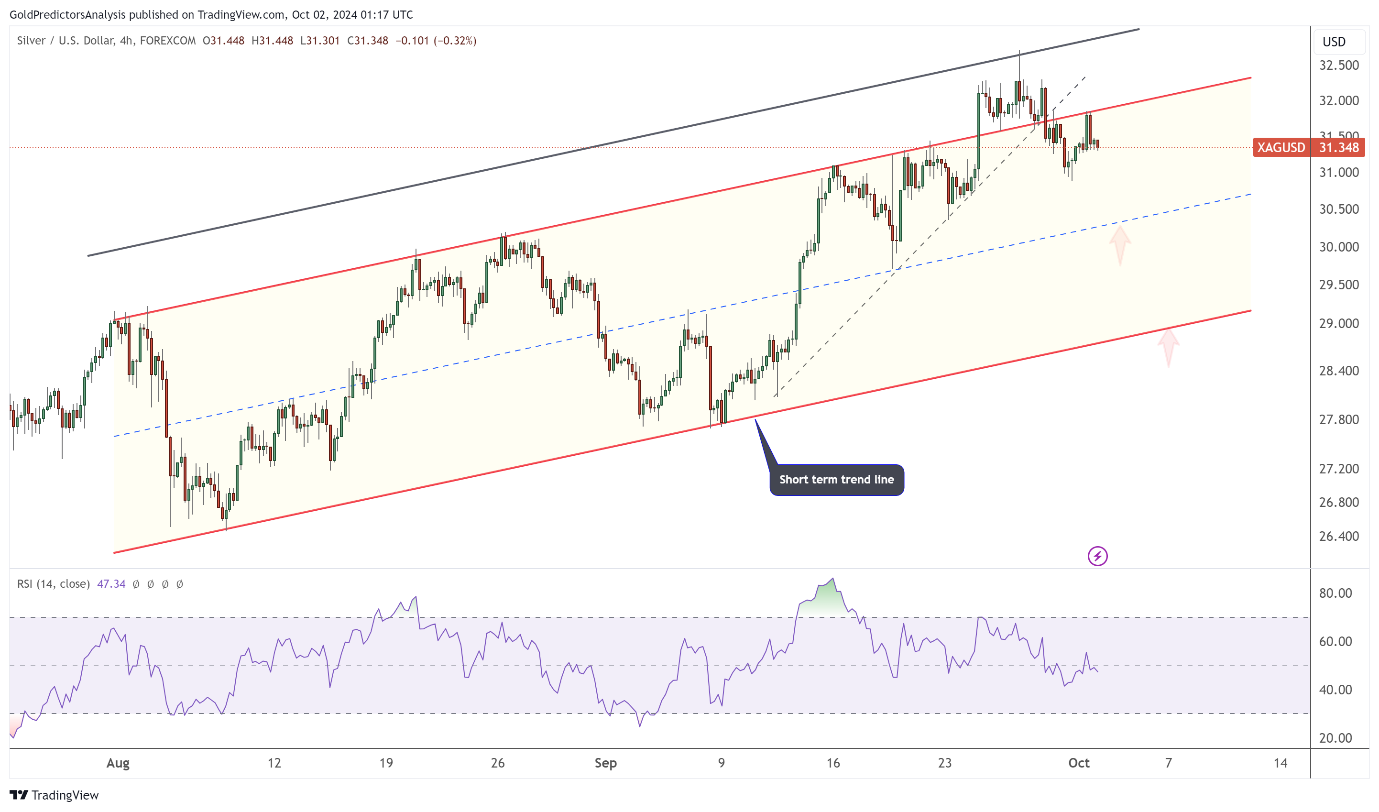
Silver 4-Hour Chart –Upward Trend Supports Price
The upward trend is also observed in the short-term 4-hour chart. The silver is trading within the upward channel. The price extended towards the black trendline to find the resistance. Silver has now broken below the immediate black dotted trendline and is dropping towards the channel’s midline. The short-term supports are $30.40 and $29, as highlighted by the red arrows in the chart.
AUD/USD Technical Analysis
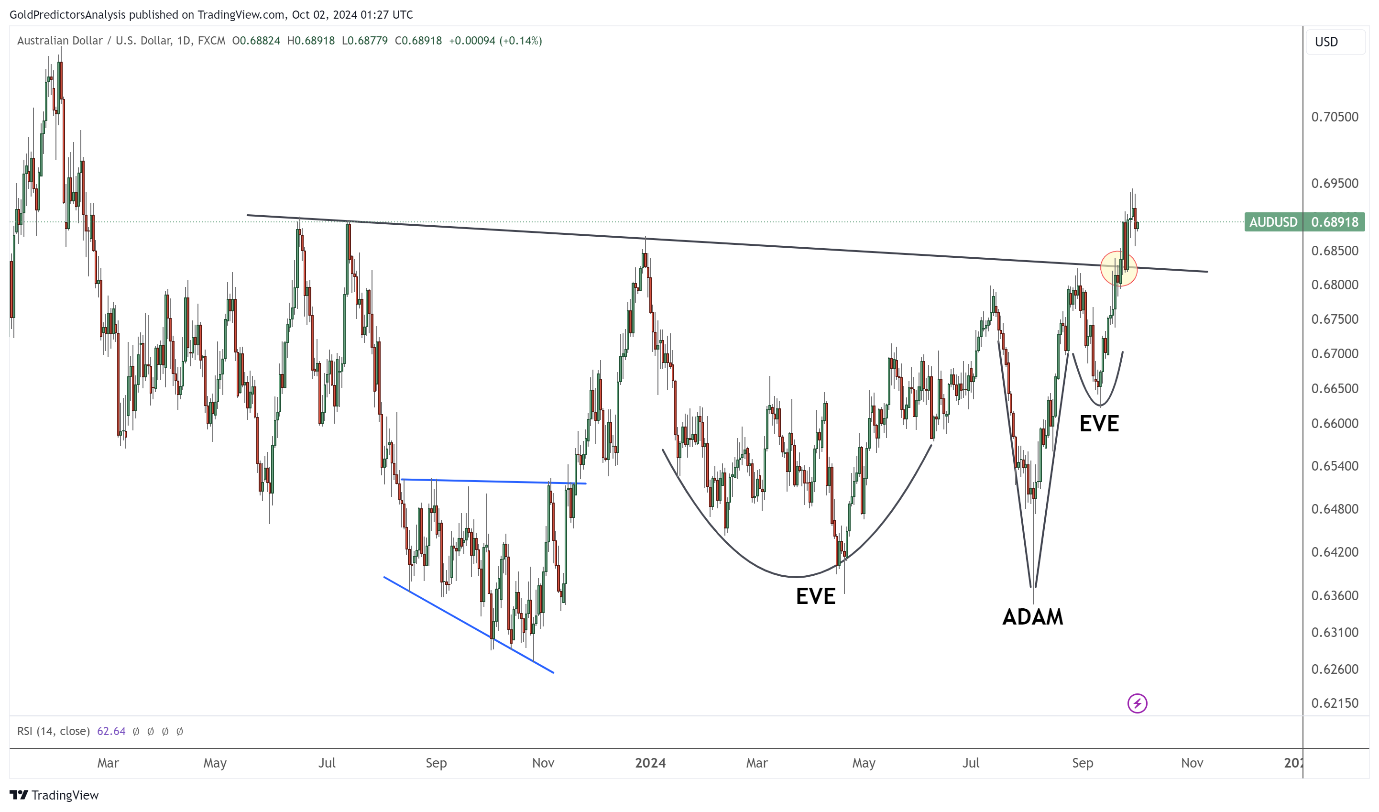
AUD/USD Daily – Adam and Eve Pattern
The Australian dollar also broke above key levels as gold reached record-high levels. Australia is a major gold producer and exporter, making its currency closely correlated with the performance of gold prices. The daily chart shows that the AUD/USD has broken above the black trend line after forming an Adam and Eve pattern. In this pattern, Adam appears before Eve; however, the concept of a double bottom is emphasized, highlighting the bullish conditions in the market. The breakout above the black trend line indicates continued upward momentum in the AUD/USD market.
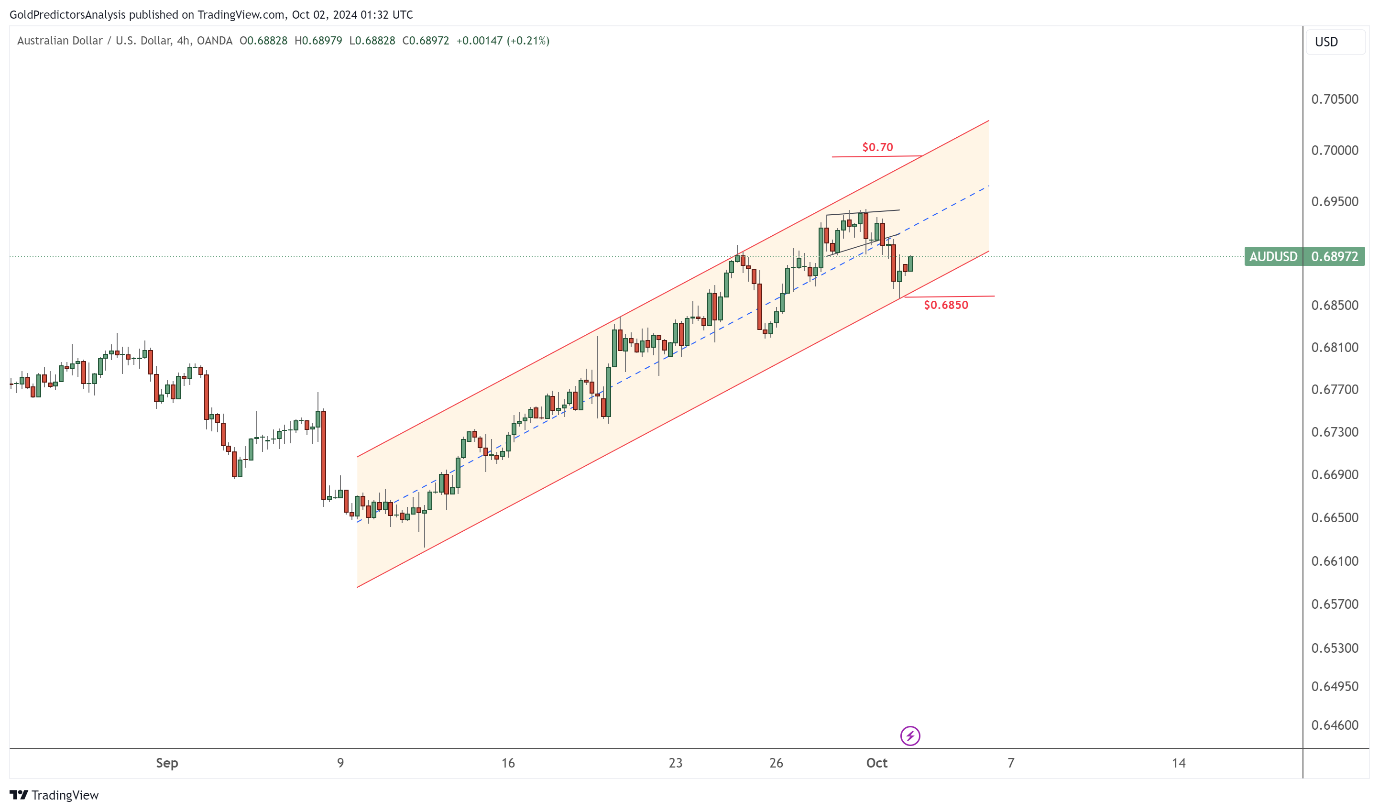
AUD/USD 4-Hour Chart – Short-Term Upward Trend
The 4-hour chart shows a similar trend as the price moves within an ascending channel pattern. The price has broken below the black trendlines within this channel and dropped towards the support at $0.6850. It rebounds higher after finding support, with the short-term resistance for AUD/USD at $0.70.
About the Author
Bob MasonChief Crypto Boss
TEST 30 He has written extensively for a broader audience and his current focus is on developments relating to the financial markets including, but not limited to currencies, commodities, alternative asset classes, and global equities.
Latest news and analysis


Advertisement