
Advertisement
Advertisement
Natural Gas Price Forecast: Eyes Breakout as Support Holds Firm
By:
Natural gas shows strength despite low volatility, holding key support levels while eyeing a potential breakout above $3.84 to confirm an extended bullish move.
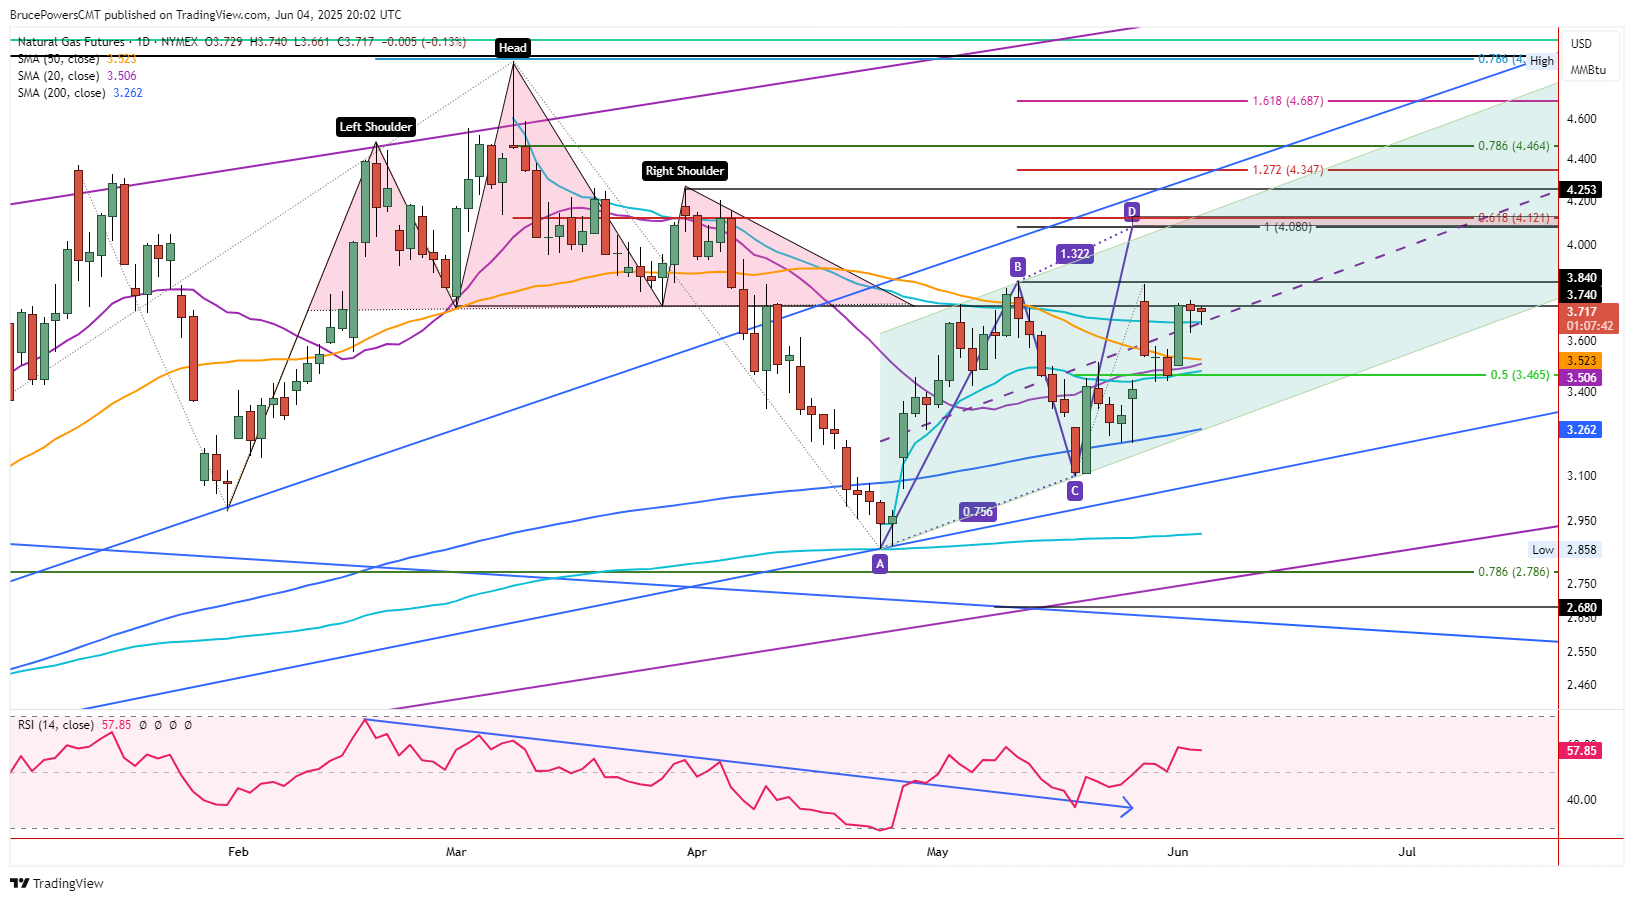
Although there was not much movement in the price of natural gas on Wednesday, it did retain signs of strength. Natural gas is on track to end the day with a narrow inside day, and it follows a narrow range day from Tuesday. The range for each day is in the top half of Monday’s trading range, which is a sign of strength. Moreover, resistance for the past few days was seen around the neckline of a head and shoulders top formation that triggered in early April at $3.73. So, a reclaim of that price level with a daily close above it would be bullish.
Challenging Key Resistance
Notice that there has been only one day since the April bottom that natural gas closed above the neckline, indicating a potential bullish breakout. The current and second test of the neckline may have greater success. Nonetheless, the recent swing high at $3.84 (B) is a key pivot that needs to be reclaimed before higher targets are valid.
Signs of Strength
At the time of this writing, the high of the day was $3.73 and the low $3.66. Notice that support for today and yesterday was found around two lines. There is a dashed line that marks the halfway point of a rising trend channel (green) and an AVWAP support line (light blue) begun from the trend high in March.
A successful test of support around those lines the past two days is a sign of strength as the lines previously represented dynamic resistance. It is also interesting to note that the weekly 20-period moving average has been converging recently with the AVWAP. Currently, they each mark a similar support level.
ABCD Pattern Triggers Above $3.84
A rise above today’s high will trigger a breakout of an inside day, while an advance above yesterday’s high of $3.76 provides a stronger bullish signal. If momentum is retained that should lead to a breakout above the $3.84 swing high and trigger a continuation of a rising ABCD pattern. An initial target from that pattern is at $4.08. But it is joined by the 61.8% Fibonacci retracement at $4.12. They should be looked at as a potential resistance area.
For a look at all of today’s economic events, check out our economic calendar.
About the Author
Bruce Powerscontributor
Bruce has been involved in the financial markets for over 20 years, as an analyst, trader, educator, and writer.


Advertisement