
Advertisement
Advertisement
Dump XRP for Ethereum? Analyst Shows Strategic Rotation is Profitable
By:
Key Points:
- Top crypto analyst ‘Doctor Profit’ exited XRP at $2.40 with 600% gains, rotating into ETH at $2,500 due to stronger fundamentals.
- Ethereum is outperforming XRP and other altcoins amid strong fund inflows, a cooling memecoin trend, and the Pectra upgrade.
- XRP/ETH chart signals a potential death cross, raising risks of deeper losses for XRP relative to Ether.

A widely followed crypto analyst has exited his XRP (XRP) position with substantial profits and rotated the proceeds into Ethereum’s native token, Ether (ETH), citing stronger upside potential.
X-based ‘Doctor Profit’ told his 408,600 followers that he secured 600% gains after liquidating his XRP positions when the price reached $2.40 two weeks ago. He then moved all the winnings to Ether when the cryptocurrency was trading for around $2,500 at the same time.
“It was a good decision,” wrote Doctor Profit, adding that XRP’s price has dipped 7% since his liquidation, while ETH’s price jumped 6%.
Why is Ethereum Outperforming Altcoins Like XRP?
Ethereum is witnessing a renaissance following the Pectra upgrade on May 7, which enhanced scalability, staking, and wallet functionality, driving an almost 50% monthly price surge and renewed investor confidence.
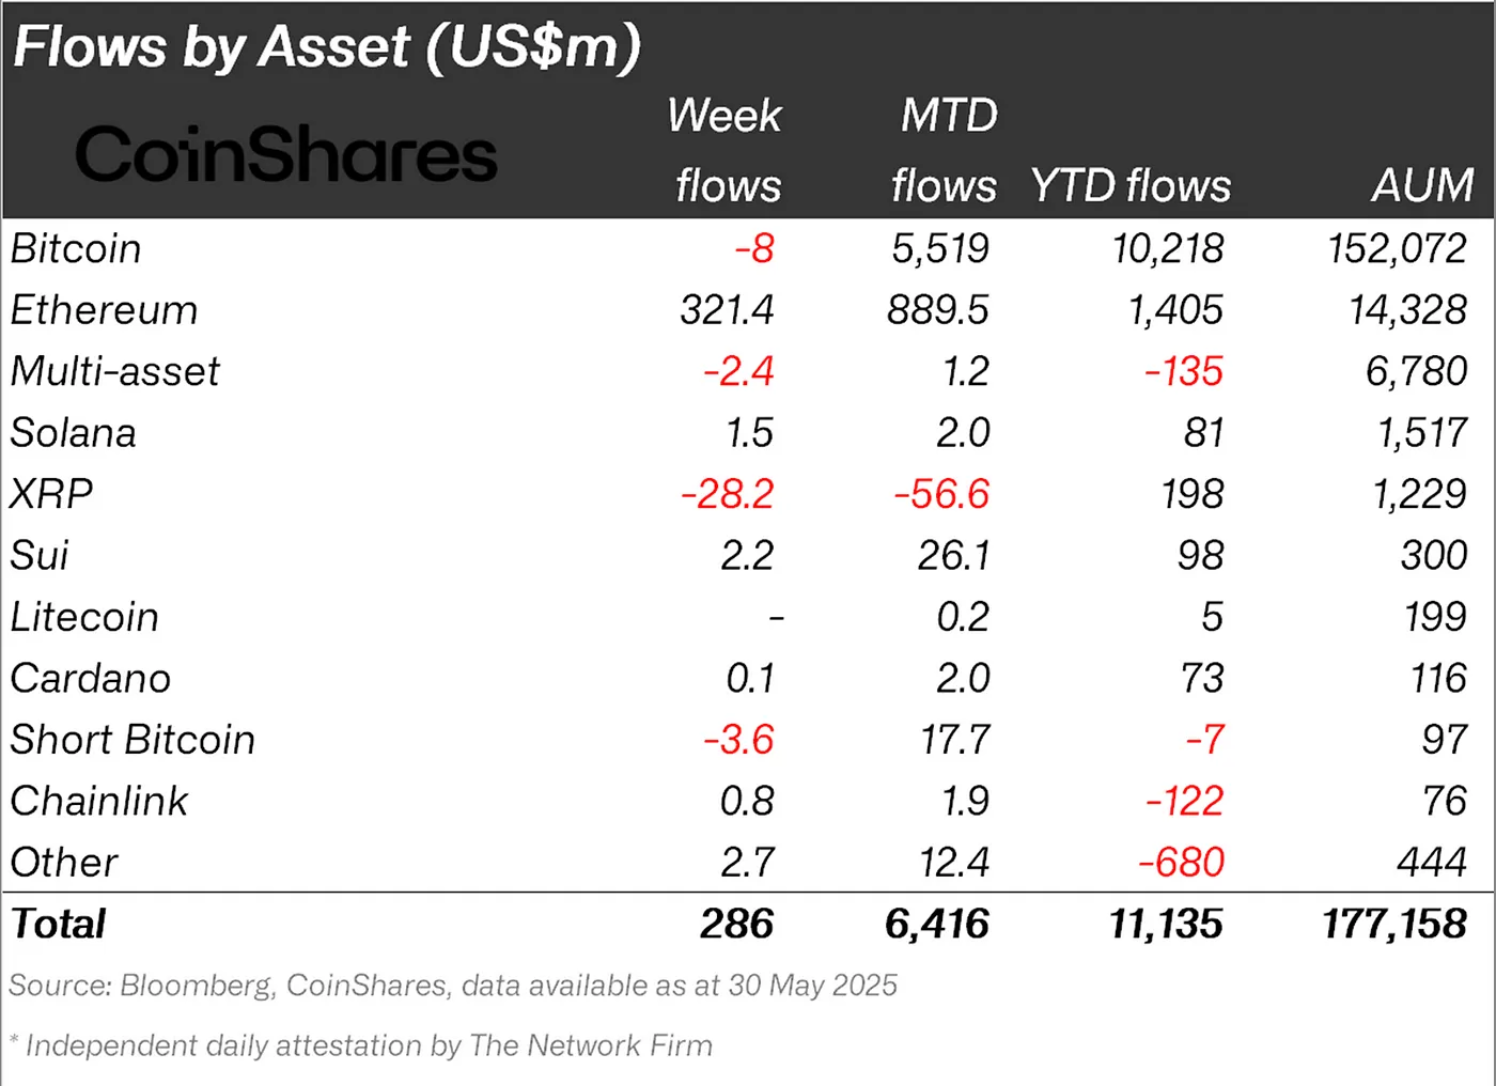
For instance, Ethereum funds witnessed $321 million in inflows in the week ending May 30, thus recording their best 6-week run since December 2024. At the same time, XRP saw its second week of outflows of $28.2 million, according to CoinShares.
Before April, Ether largely underperformed the broader crypto market in recent months, with XRP attracting interest due to the settlement of the long-running SEC vs. Ripple lawsuit, as well as the removal of anti-crypto SEC chief Gary Gensler under the pro-crypto Donald Trump administration.
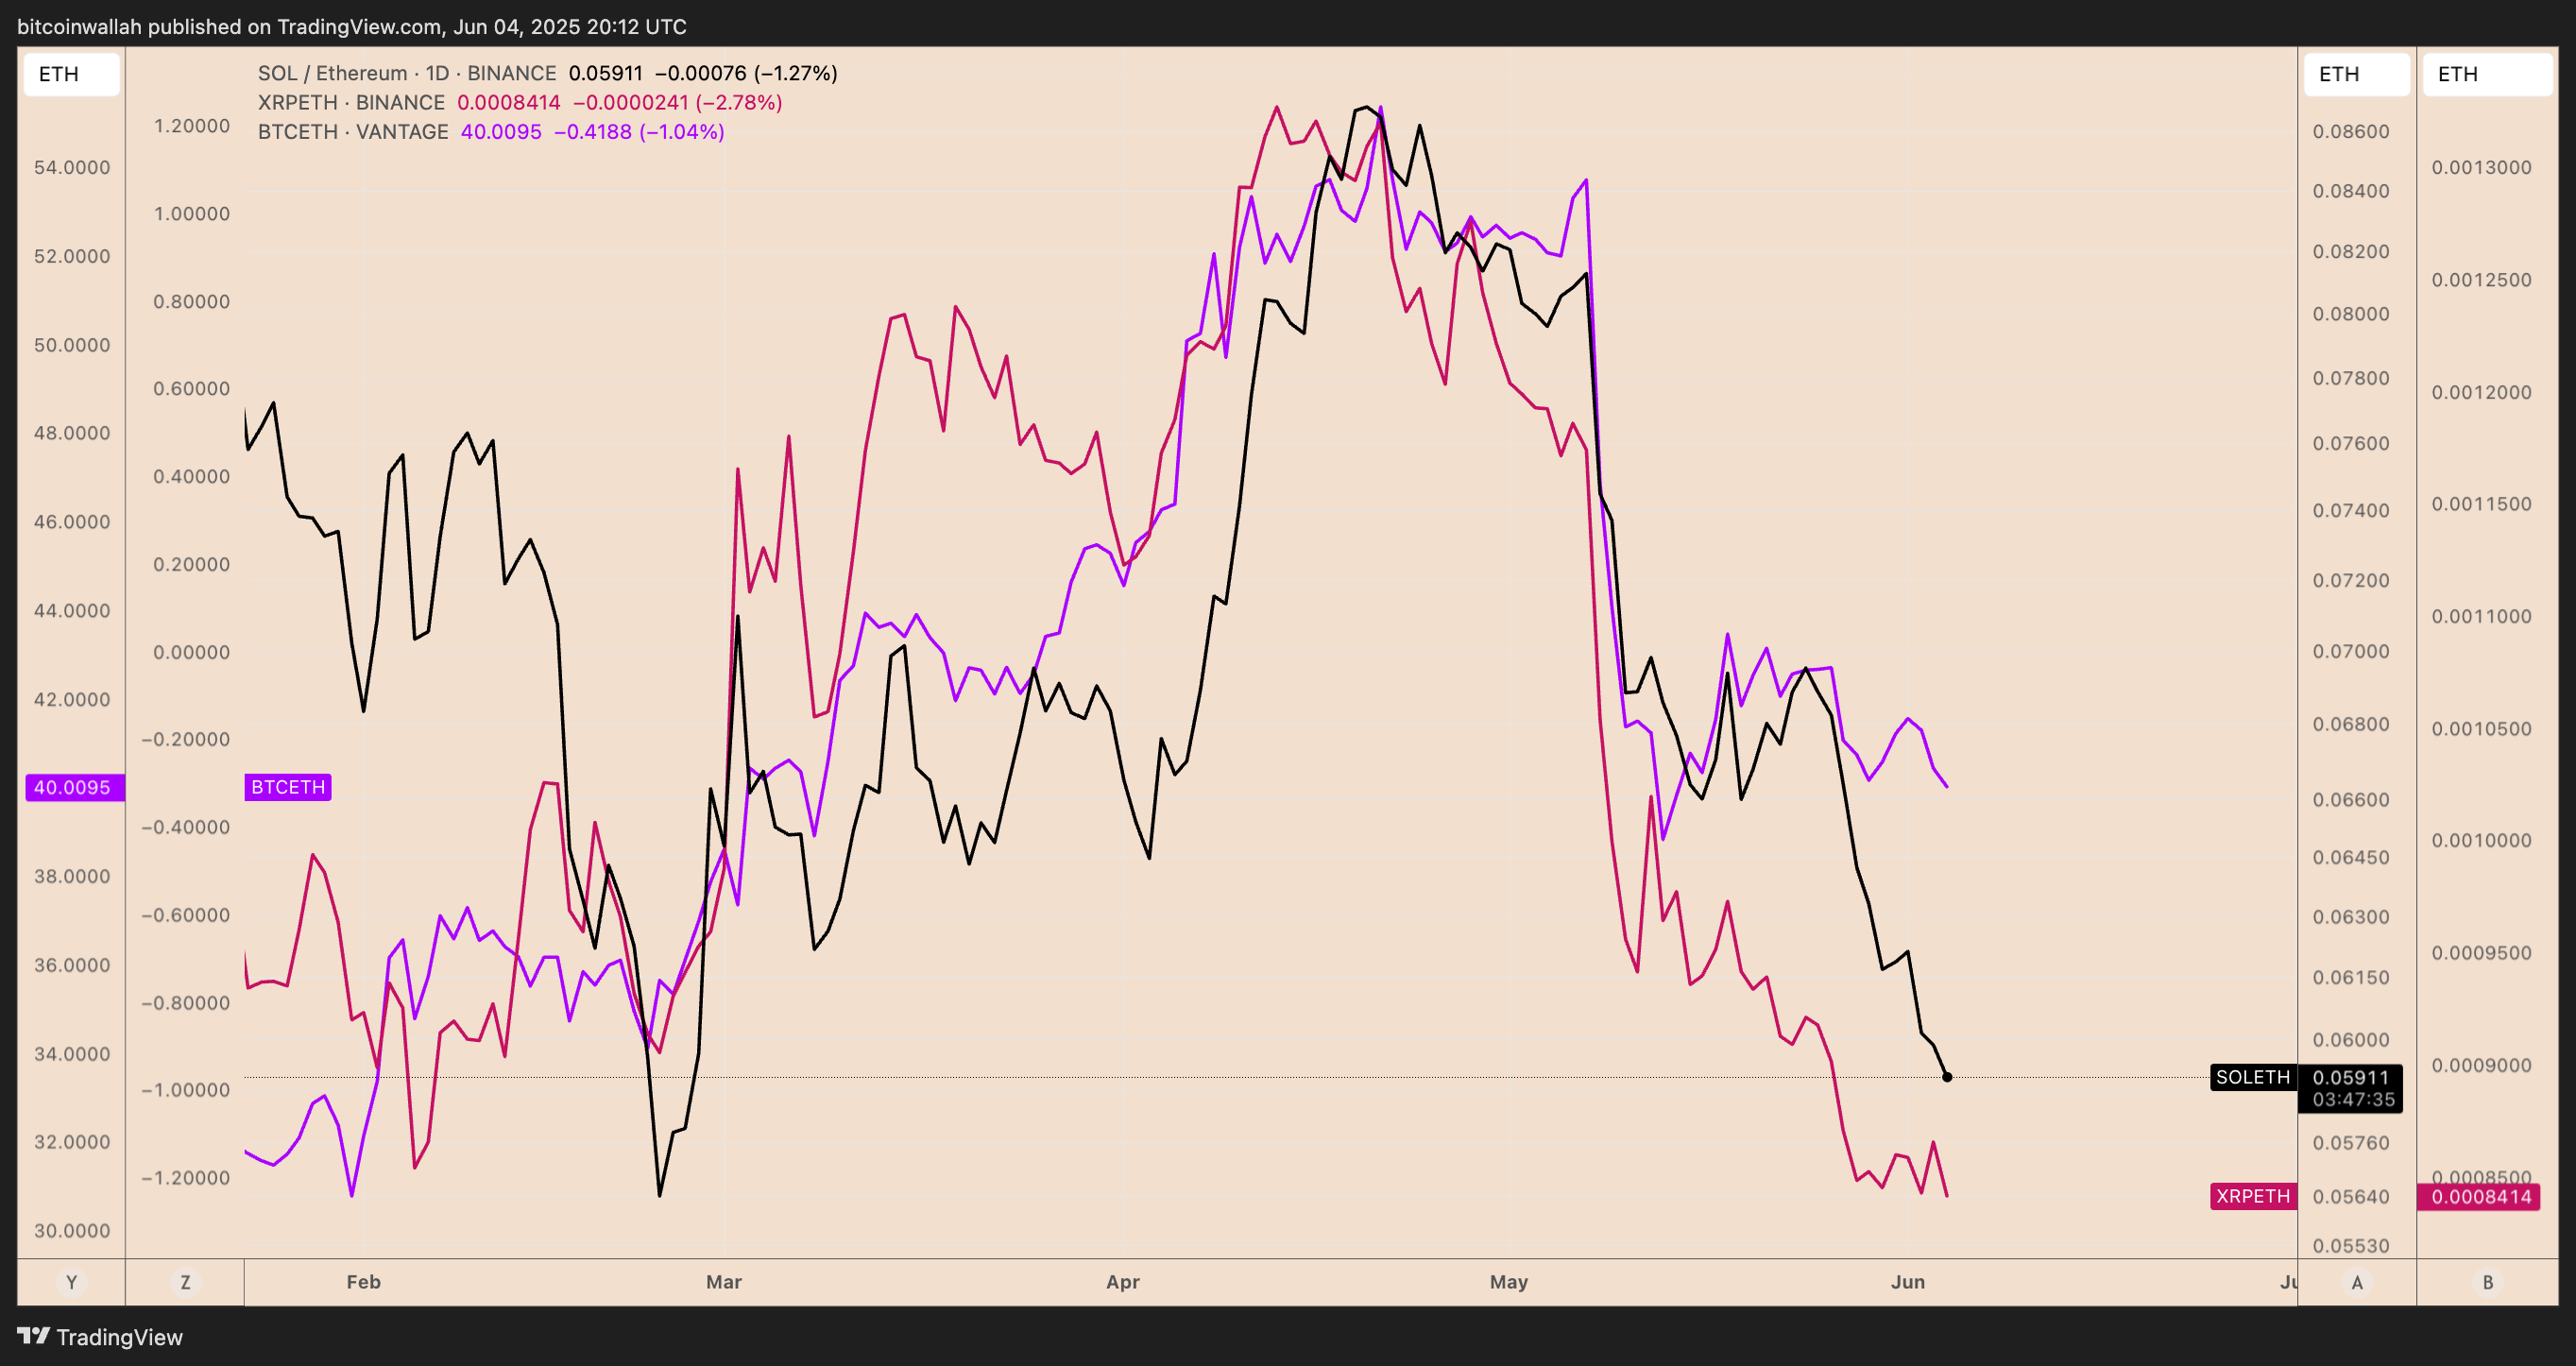
Moreover, ETH’s underperformance was also due to traders’ growing focus on the memecoin sector, which functioned massively atop Ethereum’s top layer-1 blockchain rival, Solana (SOL).
Data shows that the memecoin craze is cooling down, which is leading to a lower demand for SOL tokens, and thus leading to capital flows toward the Ethereum market.
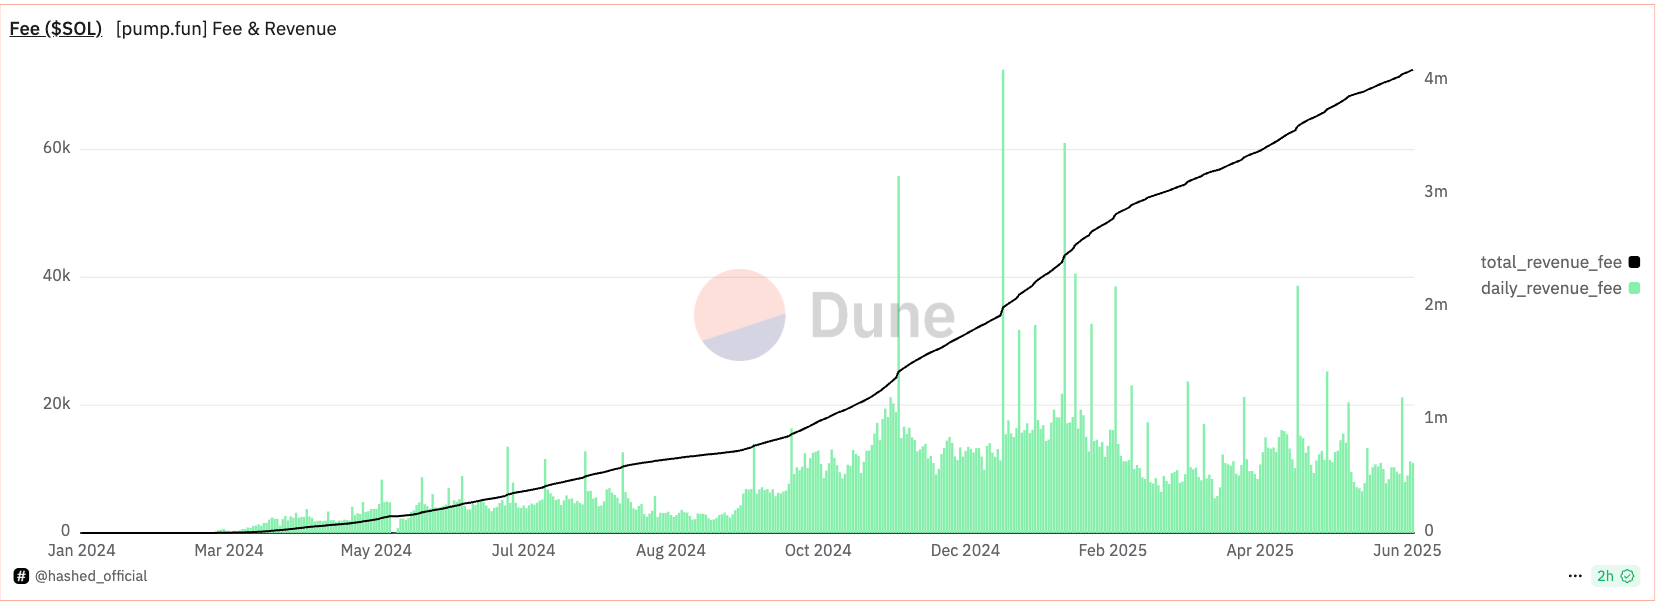
As a result, the pair comparing ETH’s relative performance versus XRP, SOL, and even top coin Bitcoin (BTC) shows impressive recoveries in the past weeks.
The latest upside fundamentals include the Ethereum Foundation’s June 3 announcement that it will undergo its biggest restructuring to date.
The overhaul includes R&D layoffs and a streamlined Protocol division focused on layer 1 scaling, blob data expansion, and user experience. New leadership roles and community governance forums aim to accelerate upgrades and address concerns over slow progress.
XRP Will Likely Form a Death Cross Versus Ethereum in June
XRP is showing renewed signs of technical weakness against Ethereum (ETH), with its XRP/ETH pair approaching a key bearish crossover that could trigger further downside.
Specifically, the 20-period exponential moving average (EMA) is on track to cross below the 50-period EMA on the 3-day chart — a setup known as a “death cross.”
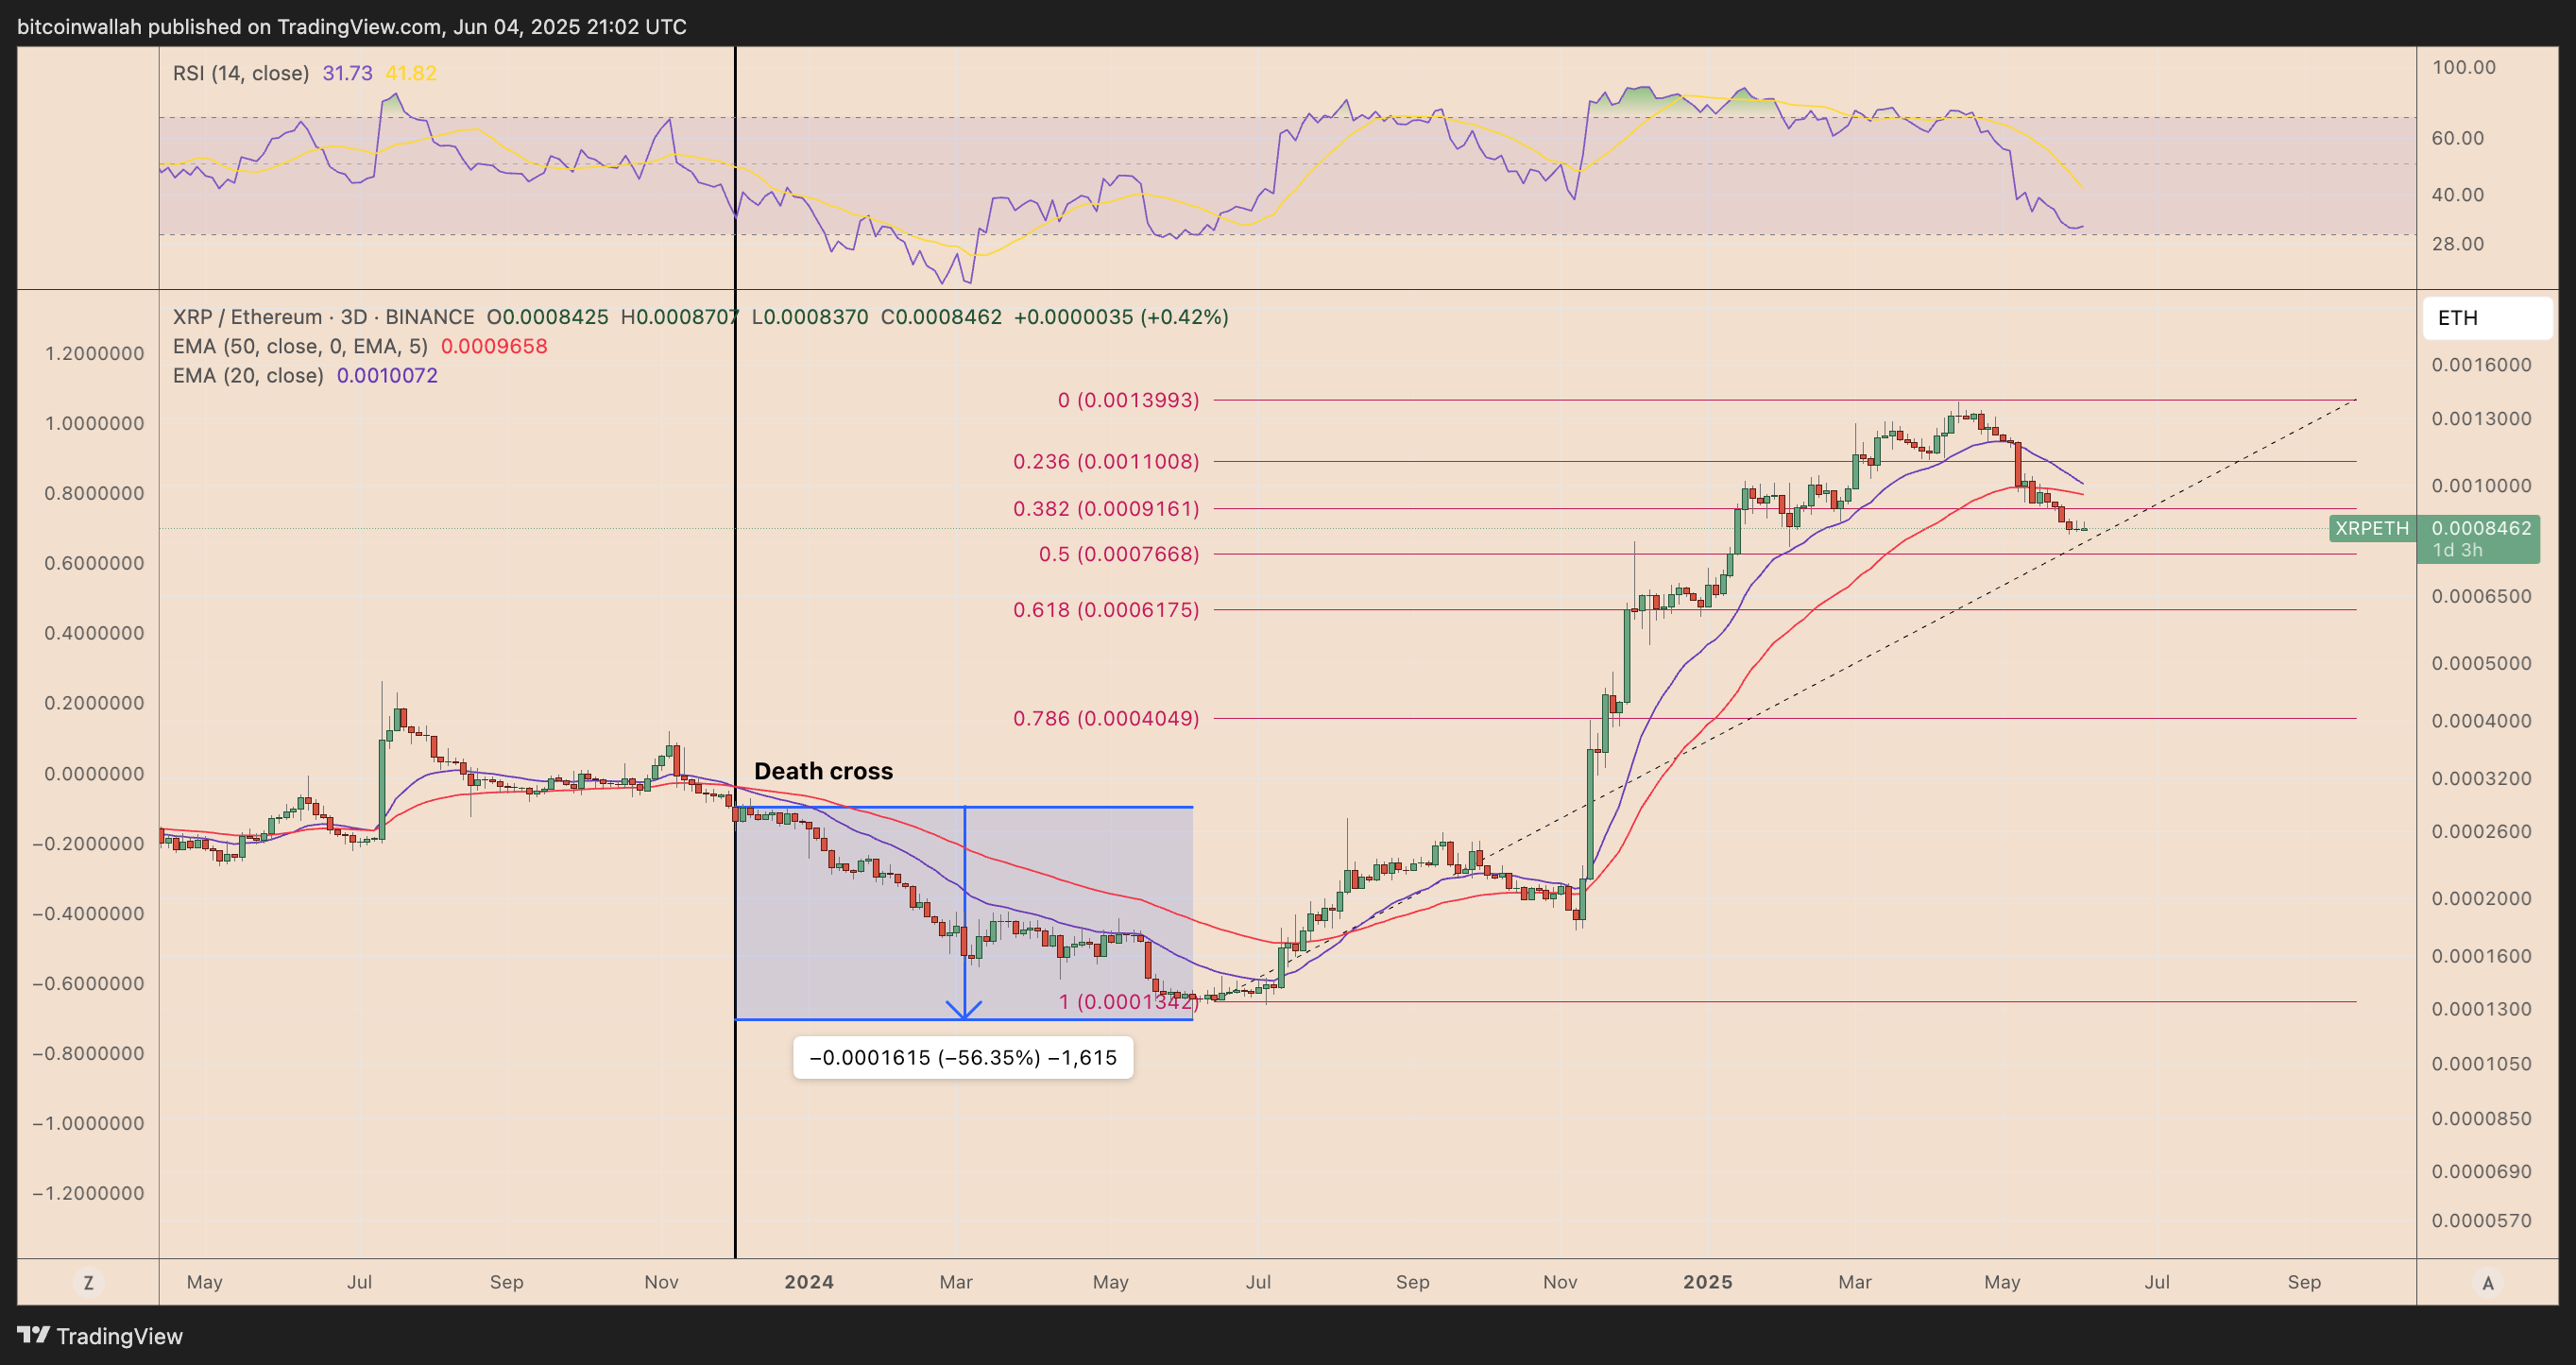
This potential crossover would mirror the late-2023 structure, when a similar EMA breakdown preceded a 56% collapse in XRP’s value relative to ETH. At the time, the death cross confirmed a longer-term shift in momentum away from XRP and into Ethereum — a pattern that now appears to be repeating.
Currently trading near 0.0008462 ETH, XRP is holding just above the 0.5 Fibonacci retracement level (0.0007668), a critical support zone.
A close below this level could open the door toward deeper retracements near 0.0006175 (0.618 Fib), or even 0.0004049 (0.786 Fib), if selling pressure accelerates.
About the Author
Bob MasonChief Crypto Boss
123456789 30 He has written extensively for a broader audience and his current focus is on developments relating to the financial markets including, but not limited to currencies, commodities, alternative asset classes, and global equities.


Advertisement