
Advertisement
Advertisement
Bitcoin Price News: BTC to $90,000? Key Levels to Watch as Pullback Unfolds
By:
Key Points:
- Bitcoin has faced strong selling pressure after making a new all-time high.
- The market could pull a long squeeze to flush out excess leverage in the BTC futures market.
- BTC could drop to the $95,000 - $90,000 range to raise enough liquidity for its next leg up.

Trading volumes have gone up by 3% in the past 24 hours, as the token has retreated by 0.7%.
Long liquidations have been normalizing lately after hitting their May peak at $206 million. However, in the past 24 hours nearly $200 million worth of long positions were flushed out as the American session opened with strong selling pressure.
Market sentiment has deteriorated recently as reflected by the behavior of the Fear and Greed Index.
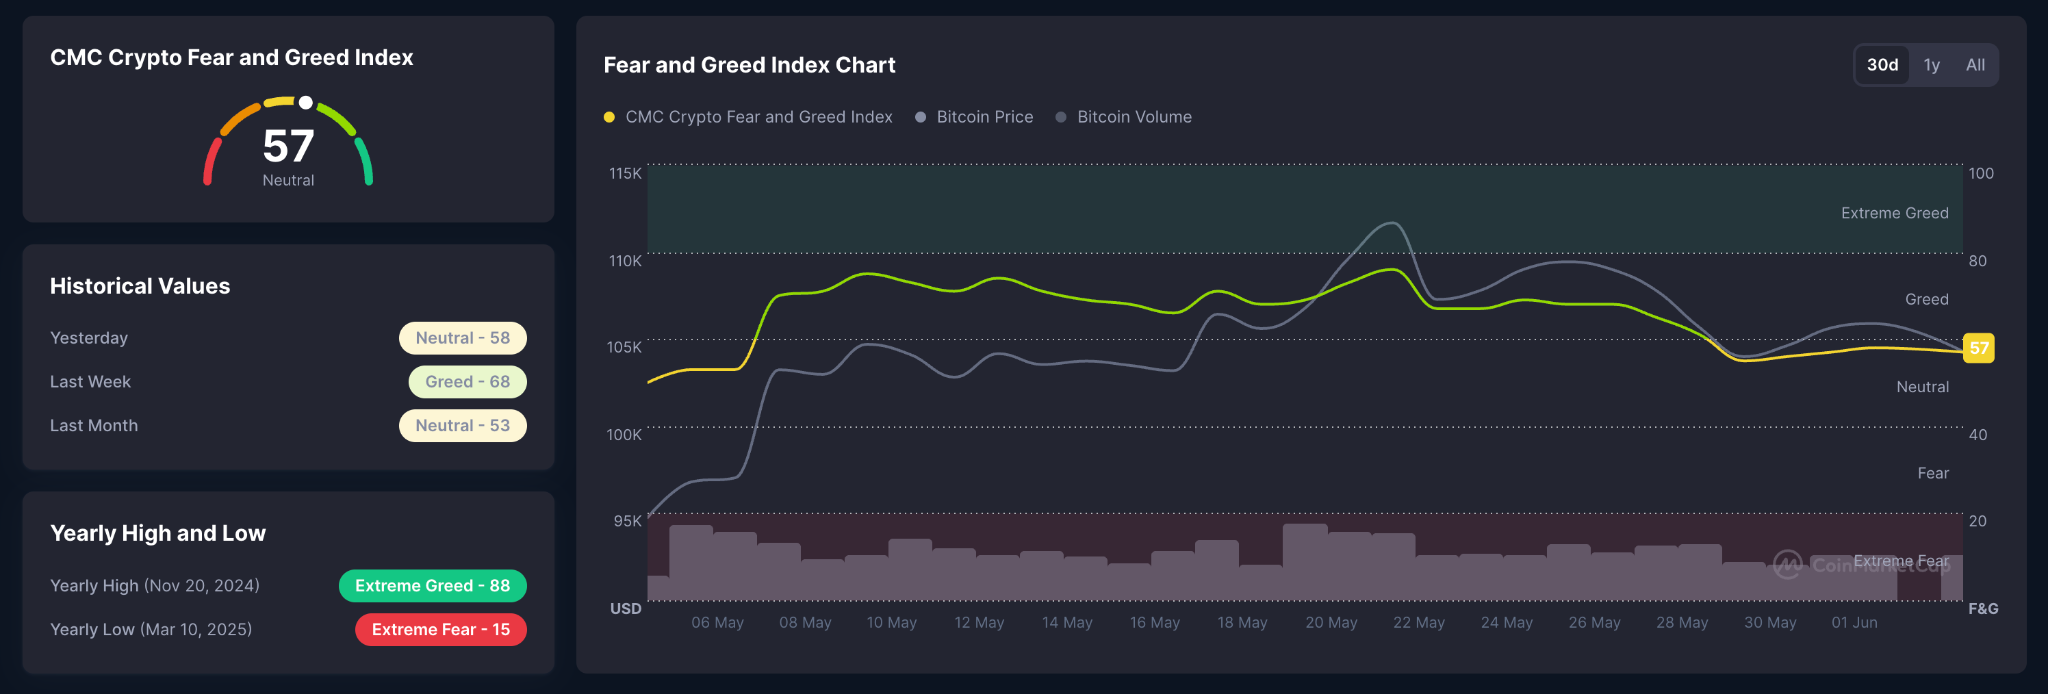
After reaching a peak of 76 in late May, this sentiment gauge has gone down to 57, meaning that investors have now adopted a neutral attitude, probably as a result of the latest escalation in the tensions between the United States and China.
Treasury Secretary Scott Bessent commented that negotiations between the two countries on a trade deal were “a bit stalled” as China refuses to concede on certain demands.
Meanwhile, open interest has been going down steadily since Bitcoin reached its latest all-time high, possibly as traders have opted to take some profits off the table rather than betting for a higher high at a point when hostilities between the two superpowers are increasing.
Declining OI supports a bearish outlook, especially at a point when there was significant FOMO. The market could now aim to pull a long squeeze to flush out excess leverage.
BTC Could Pull Back to The Mid-to-Low $90,000s
The daily chart shows that Bitcoin has dropped below its short-term EMAs already. In a previous price prediction, we emphasized that this is not abnormal as the market needs to cool off after such a strong rally.
We emphasized at that time that a clear sell signal would require a declining Relative Strength Index (RSI), which is already the case, and a bearish crossover between the 9-day and 21-day EMA. This has not yet happened.
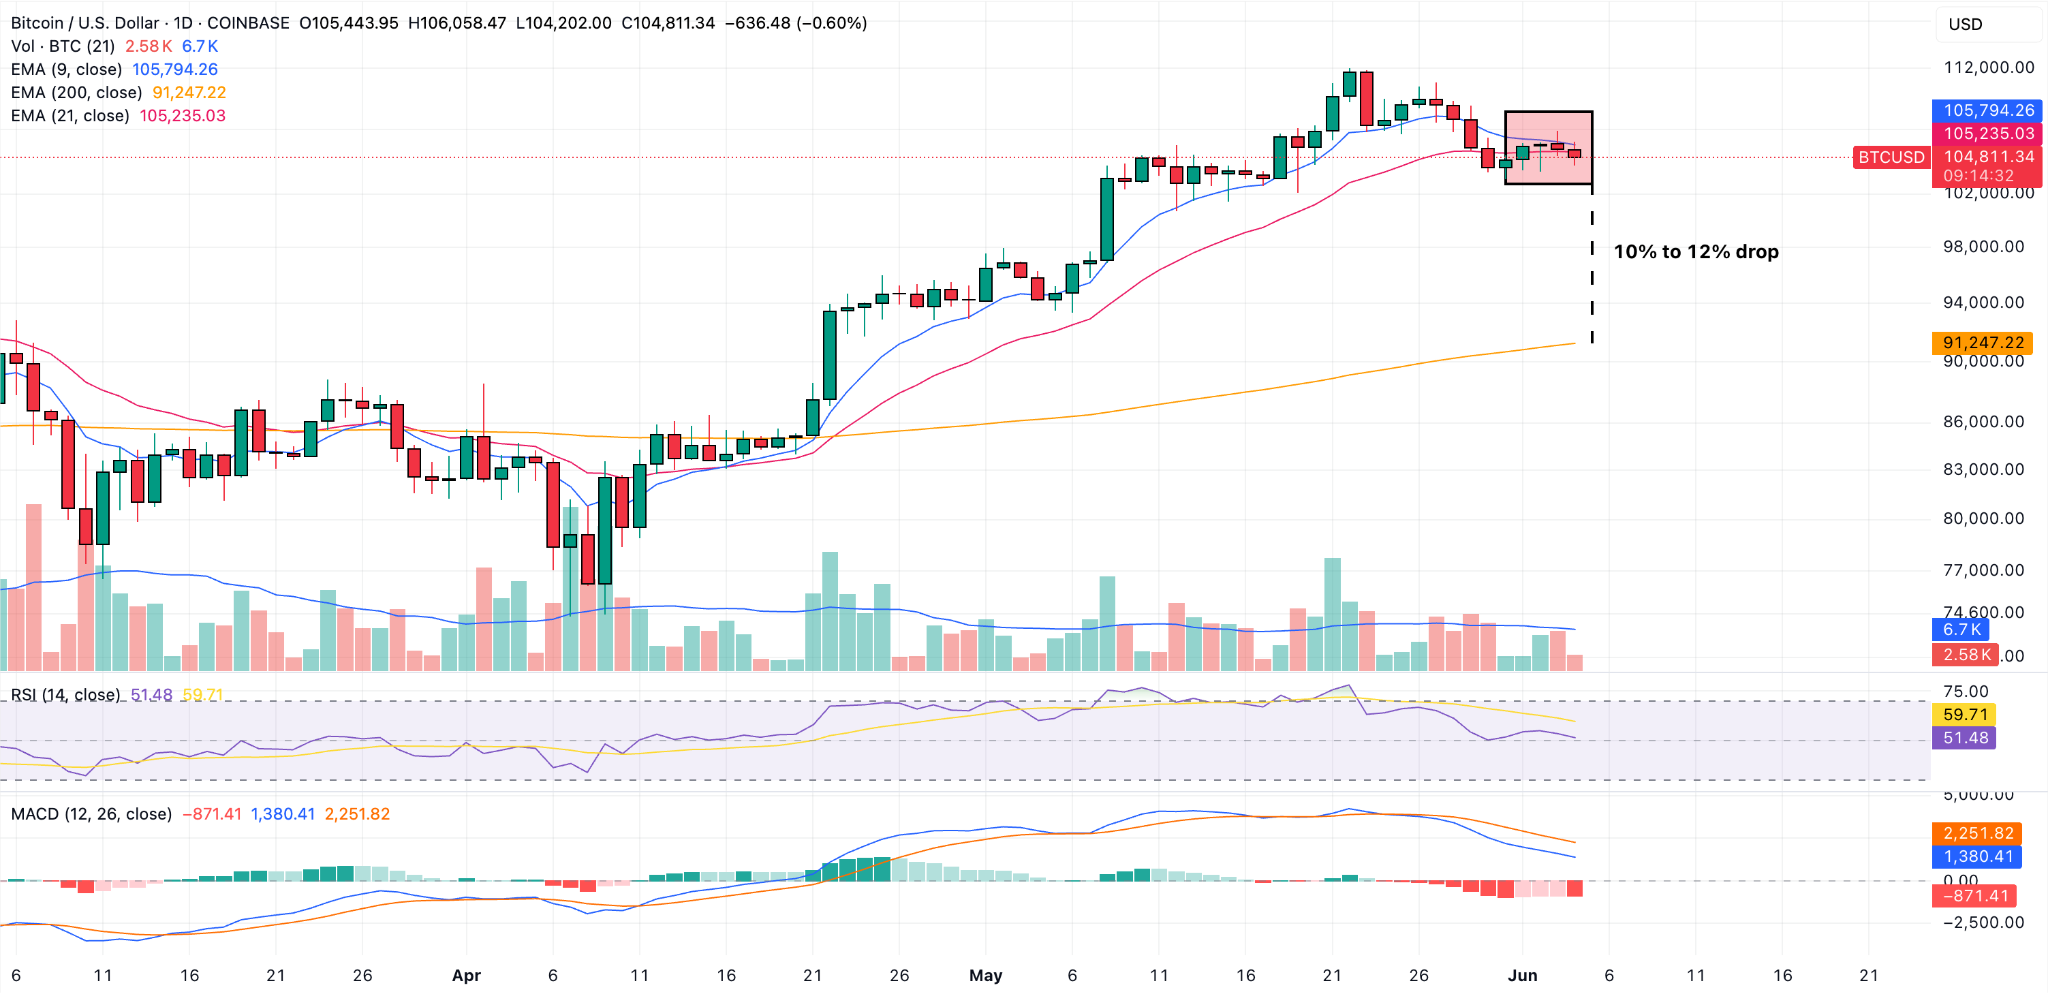
A shorter distance between these short-term moving averages initially indicates consolidation, not a bearish outlook per se.
A much deeper correction seems to be highly likely at this point in any case as BTC still stands at a far distance from its 200-day EMA. A ‘mean reversion’ move implies a downside potential of at least 10%. This would still qualify as a pullback/correction.
Key Levels to Watch for the Week
Bitcoin’s hourly chart shows the dramatic drop that has followed the token’s push to a new all-time high.
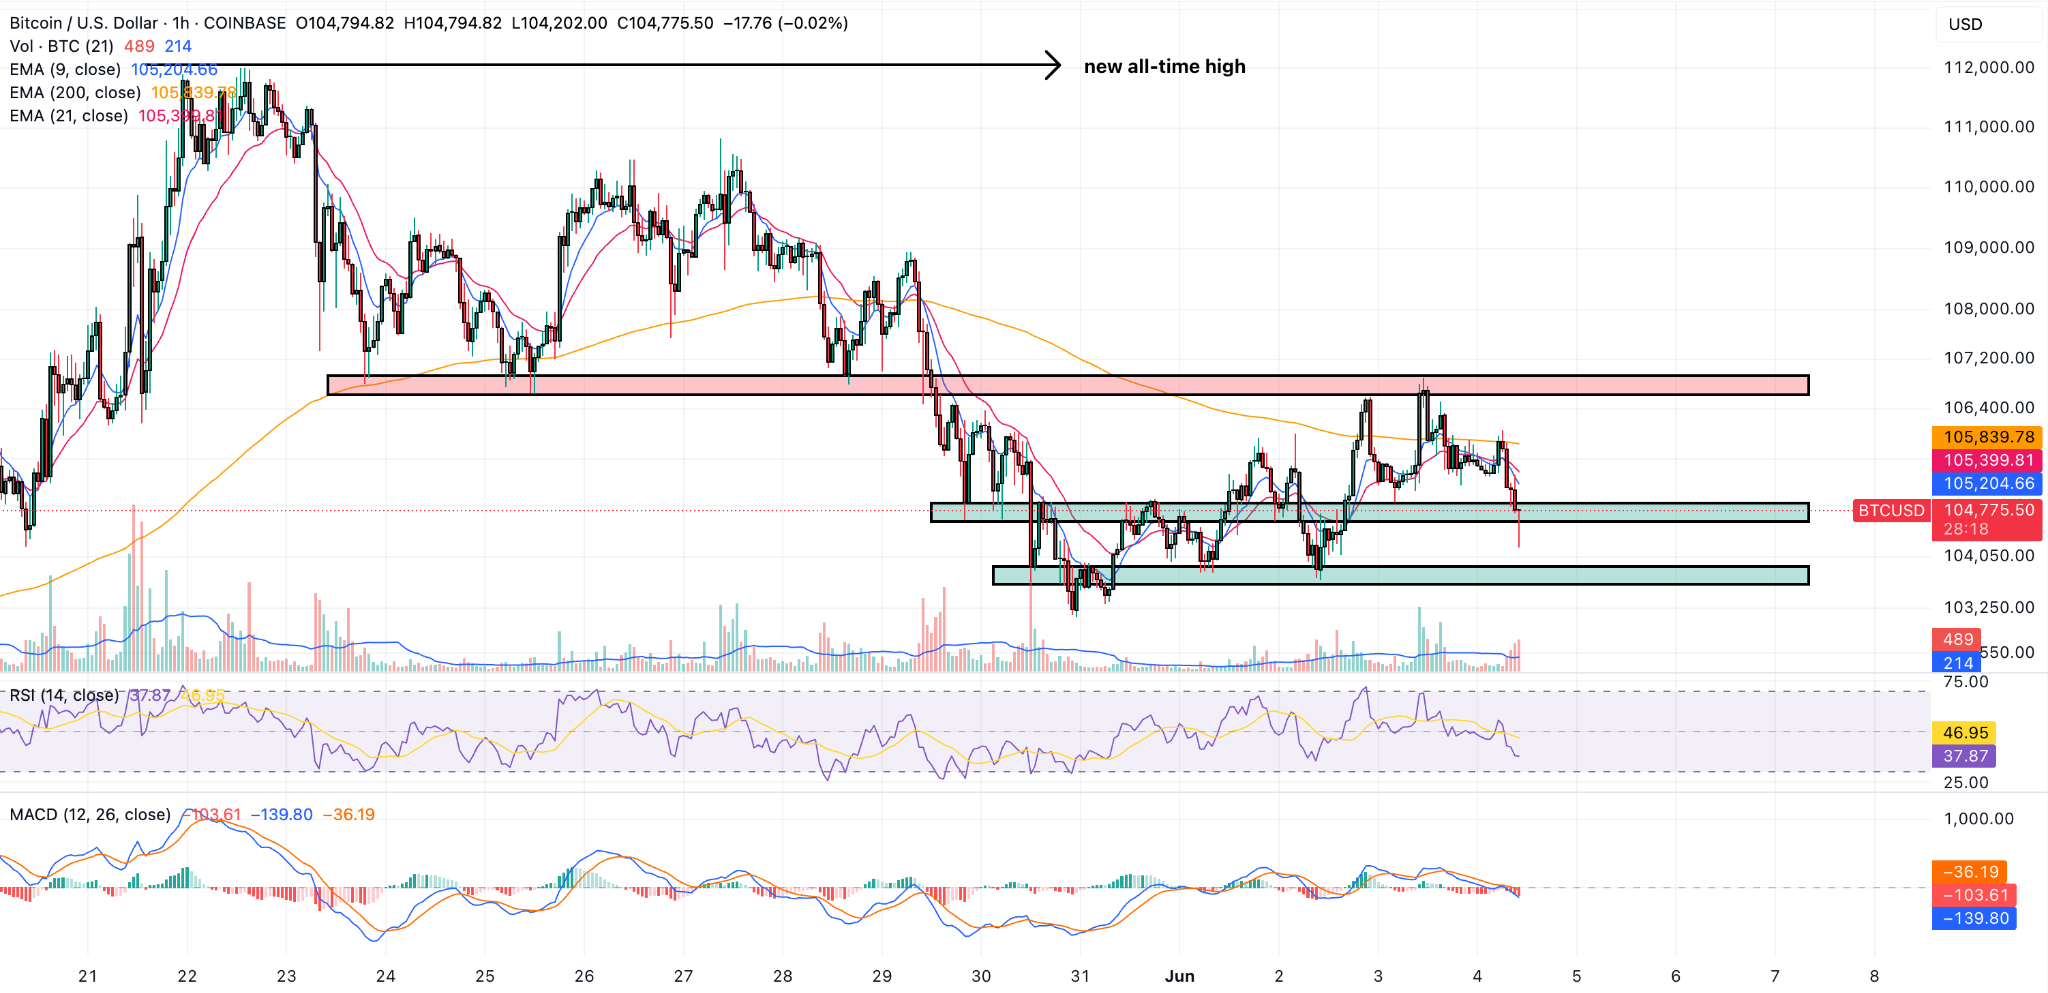
The top crypto has already broken its bullish structure and it is on a clear downtrend in this lower time frame.
The latest decline has occurred as a result of a failed push above the $107,000 – a key support/resistance area that has been quite relevant for BTC’s price action since last Friday.
The American session pushed BTC below the $105,000 level – a key support to watch – and there seems to be strong interest from buyers at this level. This could be partially a short-covering move after a strong downtrend or it could also be an order block.
The next relevant area of support to watch stands at around $103,700 if the selling pressure continues for the rest of the day.
About the Author
Bob MasonChief Crypto Boss
123456789 30 He has written extensively for a broader audience and his current focus is on developments relating to the financial markets including, but not limited to currencies, commodities, alternative asset classes, and global equities.


Advertisement